> ## Documentation Index
> Fetch the complete documentation index at: https://docs.kasoftware.com/llms.txt
> Use this file to discover all available pages before exploring further.
# 交易夥伴概覽
> 檢視知行之橋TPMC 中交易夥伴的關鍵指標和最近訊息。
每個交易夥伴都有自己的概覽儀表板,即 EDI **交易夥伴** 登陸頁面。預設情況下,它顯示過去 7 天的指標,但可以使用 **顯示資料** 下拉功能表選擇喜歡的時間段。選項包括:
* 今天
* 過去 24 小時
* 過去 3 天
* 過去 7 天
* 過去 30 天
* 過去 3 個月
* 過去 12 個月
顯示的時間段根據[清理間隔設定](../getting-started/administration/settings/cleanup-settings)而有所不同,因此可能看不到上面列出的所有時間段。
概覽儀表板分為多個部分,每個部分都在下面介紹。儀表板是使用者特定的,因此可以使用頁面頂部附近的 **編輯** 按鈕或某些卡片上的 **編輯** 連結對其進行自定義以滿足需要。
## 關鍵指標
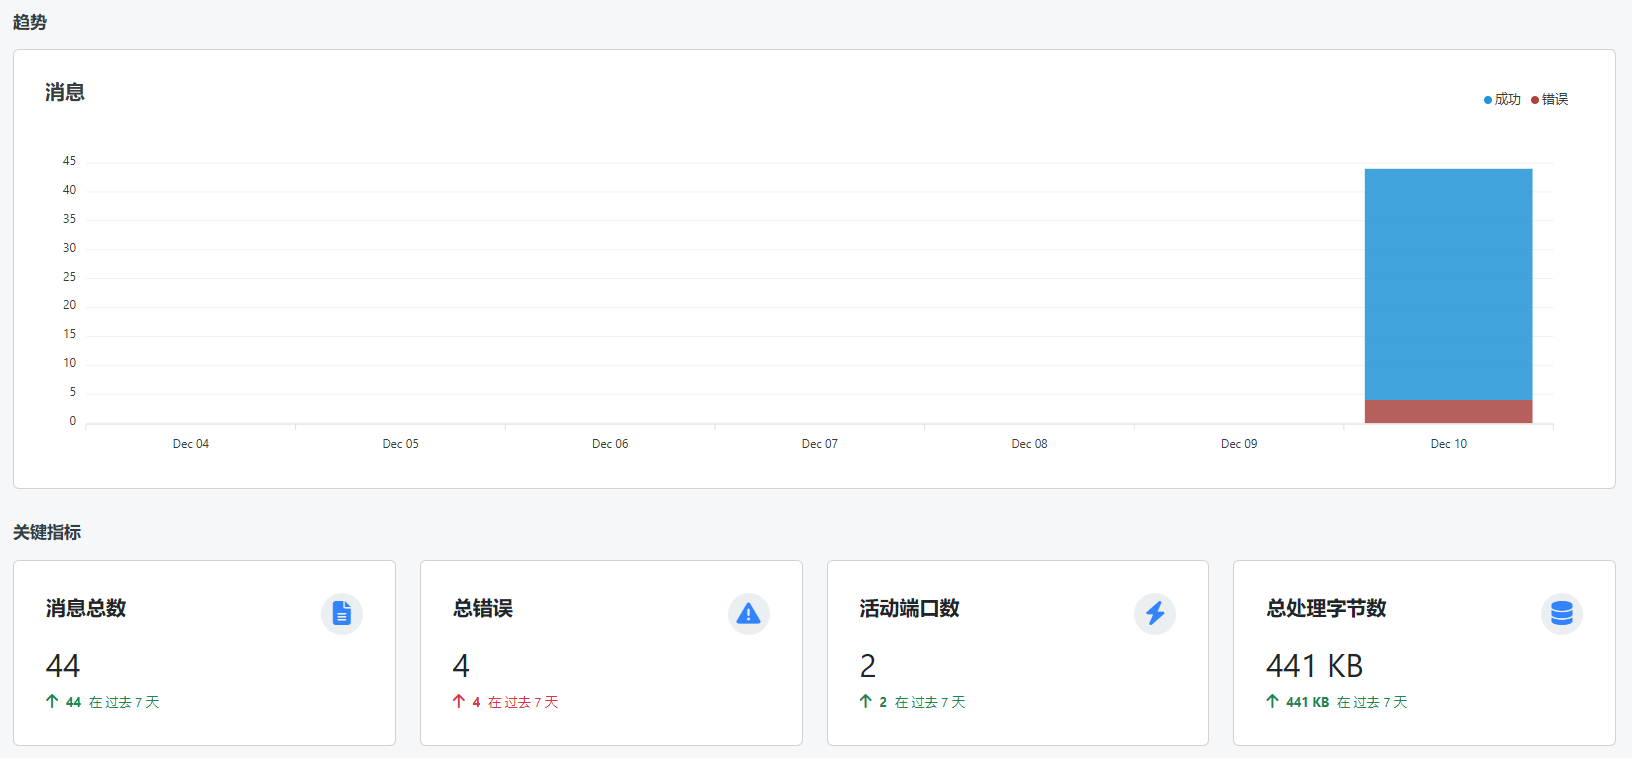 可以顯示 2 到 8 個指標,這些指標可讓您瞭解 TPMC 交易夥伴的健康狀況、吞吐量和使用情況。要選擇指標,請單擊 **編輯** 按鈕,然後單擊關鍵指標部分中的 **編輯** 連結。從以下清單中選擇:
* 訊息總數
* 交易總數
* 傳送交易總數
* 接收交易總數
* MFT 交易總數
* EDI 訊息總數
* 錯誤總數
* 傳送錯誤總數
* 接收錯誤總數
* 端口總數
* 活動端口
* 工作區總數
* 活動工作區
* 處理的總位元組數
* 處理的平均位元組數
* 平均處理時間
* 成功率
* 失敗率
* 違反 SLA 行為
* SLA 存在風險
## 訊息
可以顯示 2 到 8 個指標,這些指標可讓您瞭解 TPMC 交易夥伴的健康狀況、吞吐量和使用情況。要選擇指標,請單擊 **編輯** 按鈕,然後單擊關鍵指標部分中的 **編輯** 連結。從以下清單中選擇:
* 訊息總數
* 交易總數
* 傳送交易總數
* 接收交易總數
* MFT 交易總數
* EDI 訊息總數
* 錯誤總數
* 傳送錯誤總數
* 接收錯誤總數
* 端口總數
* 活動端口
* 工作區總數
* 活動工作區
* 處理的總位元組數
* 處理的平均位元組數
* 平均處理時間
* 成功率
* 失敗率
* 違反 SLA 行為
* SLA 存在風險
## 訊息
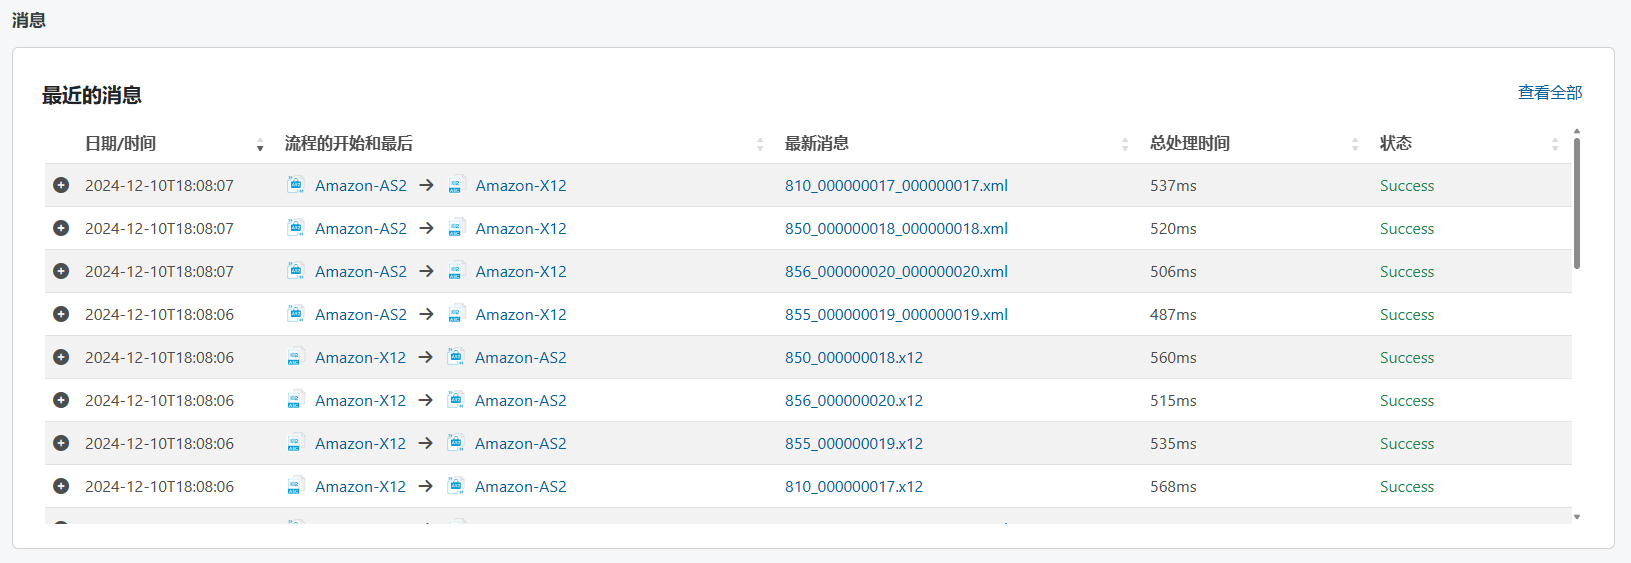 這是在 **活動 > 訊息** 索引標籤上看到的簡化檢視。它顯示最近的 25 條訊息。單擊 **檢視全部** 連結可轉到訊息索引標籤並檢視完整清單。有關詳細資訊,請參閱[訊息索引標籤](../getting-started/administration/activity#messages-tab)。